Naked Objects
By Richard Pawson and Robert Matthews
Case study: Energy Trading
Norsk Hydro is a large multi-national conglomerate, headquartered in Norway. The company's origins lie in hydro-electric power generation, but it is now also a major producer of oil and gas, and has other core businesses in aluminium and fertilizer production - all of which are energy-intensive businesses. Over the years Norsk Hydro has had to build expertise in buying and selling energy within the many national markets where it has plants.
Business background
In 2000 the European electricity market was deregulated, allowing large-scale producers or consumers of electricity to source or supply across national borders - expanding the trend that has been happening inside many national borders. (A similar trend is happening in the European natural gas industry.)
The combination of its expertise, scale, and geographic coverage in both supply and consumption allowed Norsk Hydro to gain an early lead in European energy trading. (Note: Although the collapse of Enron towards the end of 2001 generated some public cynicism about energy trading, it is now generally accepted that that disaster was caused by financial irregularities rather than by the nature of the business itself. Energy trading remains a strong, and indeed very important, business.)
Opportunity
Given the newness of the opportunity, no packaged IT solutions existed to support this activity. Trading is typically conducted on the telephone, backed up with faxes, and with large spreadsheets for analysis. This was effective for the start-up phase but clearly would not cope with the forecast growth in both the volume and complexity of the business. At some point, a purpose-designed system would be needed. The system would need to be very agile: capable of extending into new geographic areas, and accommodating finer-grained territories within individual countries. It should ideally be capable of being extended into the trading of other energy forms, especially gas. This suggested an object-oriented solution. (Object-orientation was invented in Norway in the mid-1960s, and there is still a higher awareness of the value of objects in that country than elsewhere).
A small group in the IT Strategy department became aware of the concept of Naked Objects. Apart from the obvious commitment to object-orientation, they saw two other advantages. One was the ability to use rapid prototyping to explore the requirements of a very new and rapidly-changing business domain. The other advantage was the potential to build a system that was very 'expressive' - capable of supporting the traders in their daily task of balancing their network 'positions'. The energy traders manage a large number of long-term contracts to buy electricity from producers, sell it to industrial consumers, and to transport it via power lines from one to the other. The parties that it trades with include subsidiaries of Norsk Hydro and third-party energy companies. These long-term contracts are intended to balance supply and demand. However, many contracts allow the consumers to specify their actual requirement, within specified limits, only the day before it is required. On a daily basis, therefore, the traders have to balance these variations with additional short-term contracts to buy, sell and transport, including trades on the 'spot markets' in various key centres such as Amsterdam and Leipzig. If there is a significant difference between the spot price in two of those exchanges, and the traders have access to surplus transmission capacity, then they may want to move as much as they can from one location to another.
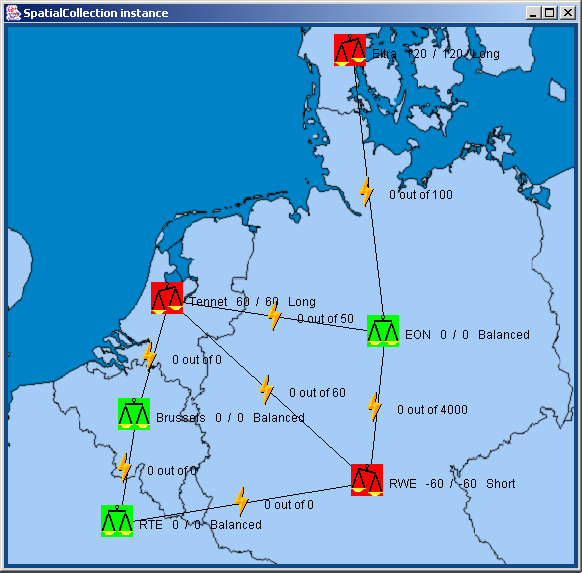
Thus, energy trading is inherently a problem solving activity. Even when the network is simple, involving just half a dozen nodes representing the Northern European countries, say, it is difficult to understand the actual trading position without some kind of visual representation. An IT strategy group at Norsk Hydro perceived that with Naked Objects it would not only be possible to produce a visual (map) representation of the position, but that it would be possible to execute all the balancing activities through this map.
Approach
Just two weeks were allocated for a team to undertake an exploratory project that had to include all the following activities:
- Train some of their own Java developers to use the Naked Objects framework
- Identify the core business objects that modelled the energy trading business
- Build a simple proof-of-concept showing how a trader would engage with these objects, through a map representation, to undertake some typical daily activities including balancing a network position.
In addition it was necessary to write an extension to the Naked Objects
framework that would support the desired visual map interface. It would be
easy to write a customized user interface that invoked responsibilities
from the underlying objects. But we wanted to try to find another
approach, one that was more in keeping with the philosophy of Naked
Objects. In the end the solution was quite elegant. We defined a new
interface, Spatial. In order to conform to this interface a
business object must be capable of yielding a pair of coordinates,
representing latitude and longitude. Then we extended the viewing
mechanism so that any collection of objects that implemented the
Spatial interface could be viewed by the user in the form of
a map, with the individual objects showing up as icons positioned on that
map . The map backgrounds were provided as image files and specified
through a configuration file. The result is that the entire application
could still be written without the business objects knowing anything about
the user interface, and without having to write any application-specific
user interface code. We have some more work to do in refining this
concept, but such a capability will be released in a future version of the
framework.
Evaluation
The exercise was considered to be very successful. In addition to the Java developers, the team included IT strategists representing both the electricity and gas trading businesses. The latter reported that they found the experience of taking part in the design process to be enjoyable and rewarding. In the interests of speed, a great deal of the development and debugging was done live in front of these user representatives even though they were not programmers.
The proof-of-concept has now been taken to the energy businesses for evaluation. If successful it is hoped that this will lead to a full-scale implementation.
Here is a brief explanation of each of the business classes together with an illustrative responsibility. (Each object has many more responsibilities).
Trading Party

May be a Norsk Hydro subsidiary or third party. Knows how to create a new Contract using default values for this party.
Exchange

(Sub-class of Trading Party.) Knows how to quote a spot price for a given period.
Contract

Knows the Trading Party, Period and type of contract (buy, sell, transmission, short-term, long-term, etc). Knows the Power Requirement.
Power Requirement (volume)

In its simplest form this is just a standard value object - a number and a unit of measurement (Megawatts), with the ability to perform standard arithmetic operations. Modelling it as a business object allows for more sophisticated power requirements e.g. variable limits, or profiles that vary throughout the day.
Network

Knows the Locations and Links that make up this Network, and how to generate a Network Position for a given period (usually a day). Treating the network as a business object in its own right will allow the traders to handle multiple networks, which are either geographically distinct, or which handle different forms of energy (e.g. gas). Knows how to add new Locations and Links.
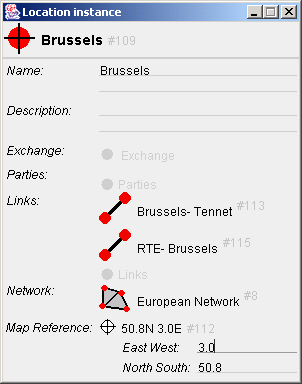
Location

Models a node in the Network. Knows the Trading Parties that operate in this Location, and how to buy or sell on the local Exchange if there is one. Knows how to create a Location Position for a given period.
Link

Models a transmission line between two Locations. Knows how to buy or sell capacity from appropriate Trading Parties.
Network Position

This is position in the sense of trading (e.g. long, short, balanced) not geography. The Network Position is made up from the individual Location Positions and Link Positions for the same period. Knows how to calculate the profitability of the Position.
Location Position

Knows how to find and summarize Contracts active at this Location in the specified period.
Link Position

Knows how to calculate how much of the available capacity is being used. Knows how to create a 'movement' (an operational instruction to transmit a specified amount of power).
A typical energy trading scenario
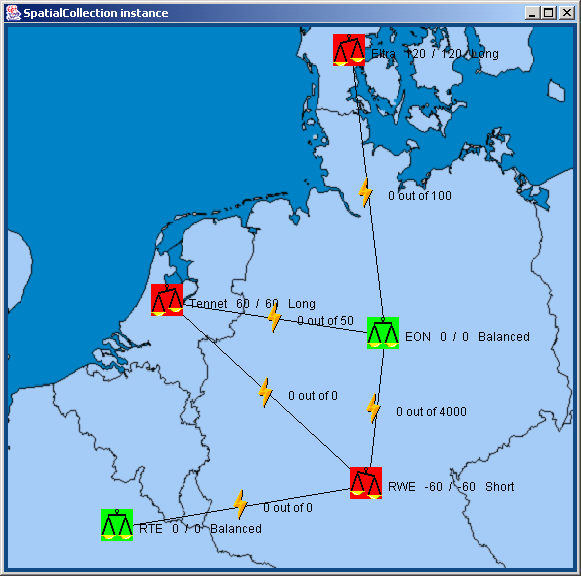
The day's Network Position shows that we are 60 Megawatts (MW) 'long' in the Tennet location and 60 MW short in the RWE location:
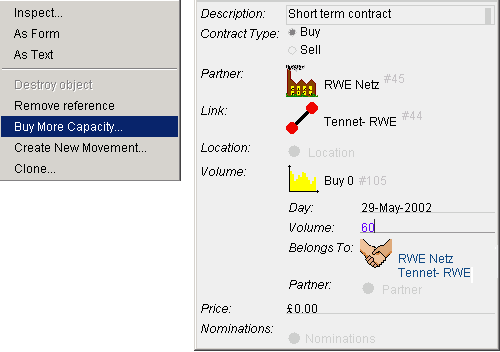
Right-clicking on the Link Position for the Link between the two, we select 'Buy More Capacity', which creates a new 'short-term' Contract with the owner of that Link, for which we specify a flat Power Profile of 60MW:
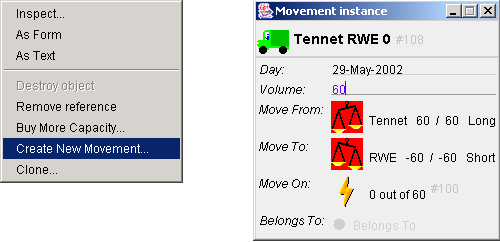
We now have transmission capacity to move power from where we are long to where we are short (this might take several trades at different prices). Right clicking on that link position again we can now create a Movement instructing the line operator to 'transport' 60 MW:
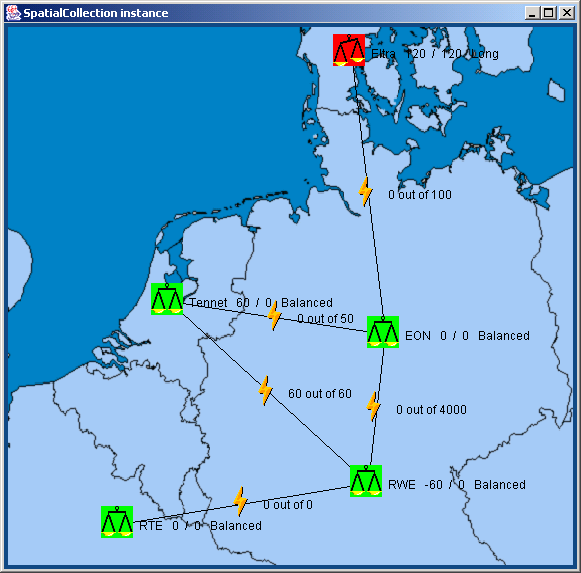
The green Location Position icons (scales) show that we are now balanced in Tennet and RWE, but still have the Eltra Location to balance:
As the business grows, new Locations, Links and whole Networks can be added just by creating new object instances:
The newly-added location and links are immediately available for trading:
Copyright (c) 2002 nakedobjects.org You may print this document for your own personal use, or you may copy it in electronic form for access within your organisation, provided this notice is preserved.